Cross-Border Ecommerce Margin Checklist 2026: Real Costs to Track
A practical 2026 margin checklist for cross-border DTC teams: duties, shipping, payments, returns, tax, localization, platform fees, and market-level contribution margin.
Read more
Stop guessing why your store isn't making money. Use this framework to map your ecommerce sales funnel, identify the biggest conversion leaks, and prioritize fixes that actually drive revenue.
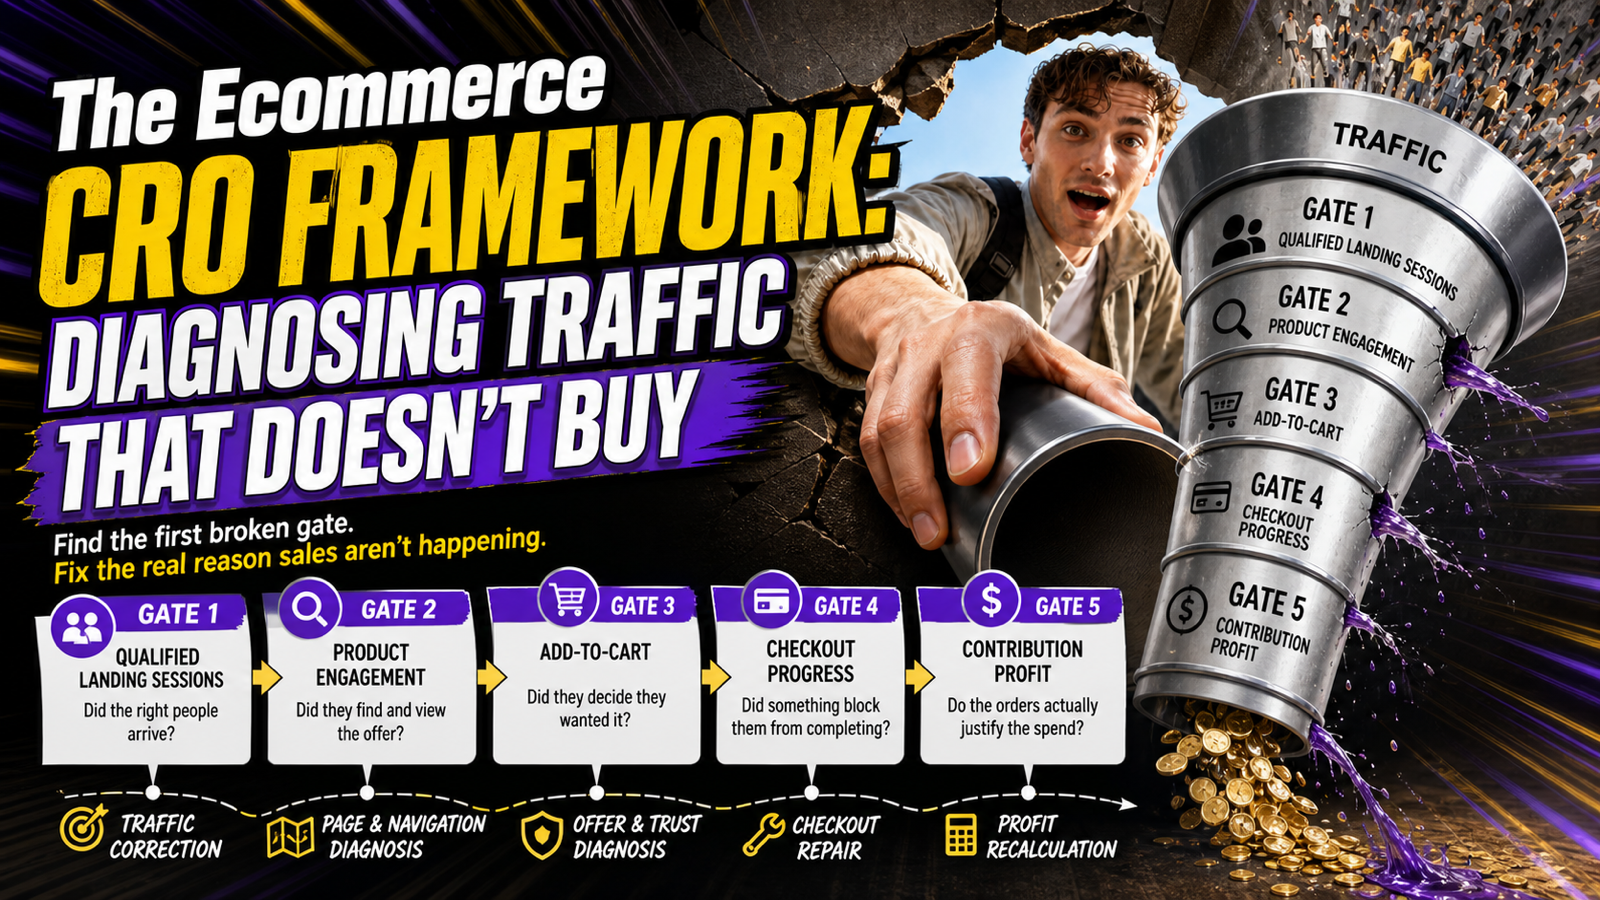
Getting traffic but no sales—or generating orders that do not cover your acquisition costs—is the most expensive operational leak in ecommerce. When return on ad spend drops, the instinct is often to execute a sitewide redesign, change advertising platforms, or blindly copy competitor tactics.
However, effective ecommerce conversion rate optimization (CRO) requires isolating the exact stage where qualified demand breaks down. You cannot fix a checkout problem with better product photography, and you cannot fix bad ad targeting with a faster website. Instead of guessing, operators must locate the first material break in the ecommerce sales funnel. By evaluating five sequential gates, you can route your store to the correct diagnostic path and fix the actual failure point before changing anything else.
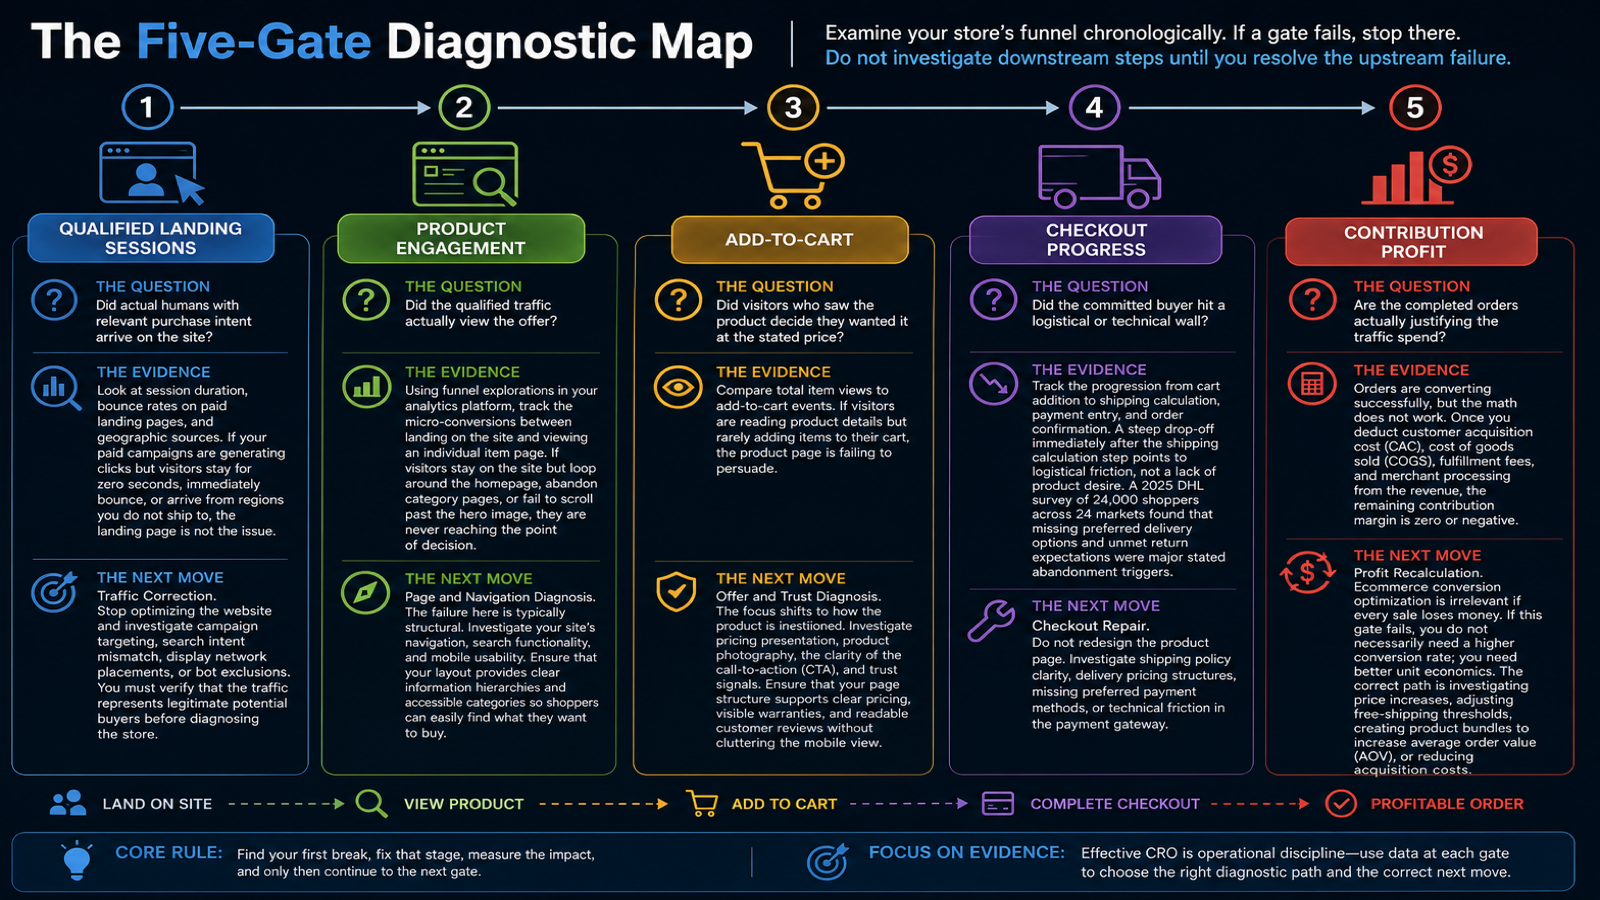
To find your first break, examine your store’s funnel chronologically. If a gate fails, stop there. Do not investigate downstream steps until you resolve the upstream failure.
The Question: Did actual humans with relevant purchase intent arrive on the site?
The Evidence: Look at session duration, bounce rates on paid landing pages, and geographic sources. If your paid campaigns are generating clicks but visitors stay for zero seconds, immediately bounce, or arrive from regions you do not ship to, the landing page is not the issue.
The Next Move: Traffic Correction. Stop optimizing the website and investigate campaign targeting, search intent mismatch, display network placements, or bot exclusions. You must verify that the traffic represents legitimate potential buyers before diagnosing the store.
The Question: Did the qualified traffic actually view the offer?
The Evidence: Using funnel explorations in your analytics platform, track the micro-conversions between landing on the site and viewing an individual item page. If visitors stay on the site but loop around the homepage, abandon category pages, or fail to scroll past the hero image, they are never reaching the point of decision.
The Next Move: Page and Navigation Diagnosis. The failure here is typically structural. Investigate your site’s navigation, search functionality, and mobile usability. Ensure that your layout provides clear information hierarchies and accessible categories so shoppers can easily find what they want to buy.
The Question: Did visitors who saw the product decide they wanted it at the stated price?
The Evidence: Compare total item views to add-to-cart events. If visitors are reading product details but rarely adding items to their cart, the product page is failing to persuade.
The Next Move: Offer and Trust Diagnosis. The focus shifts to how the product is positioned. Investigate pricing presentation, product photography, the clarity of the call-to-action (CTA), and trust signals. Ensure that your page structure supports clear pricing, visible warranties, and readable customer reviews without cluttering the mobile view.
The Question: Did the committed buyer hit a logistical or technical wall?
The Evidence: Track the progression from cart addition to shipping calculation, payment entry, and order confirmation. A steep drop-off immediately after the shipping calculation step points to logistical friction, not a lack of product desire. A 2025 DHL survey of 24,000 shoppers across 24 markets found that missing preferred delivery options and unmet return expectations were major stated abandonment triggers.
The Next Move: Checkout Repair. Do not redesign the product page. Investigate shipping policy clarity, delivery pricing structures, missing preferred payment methods, or technical friction in the payment gateway.
The Question: Are the completed orders actually justifying the traffic spend?
The Evidence: Orders are converting successfully, but the math does not work. Once you deduct customer acquisition cost (CAC), cost of goods sold (COGS), fulfillment fees, and merchant processing from the revenue, the remaining contribution margin is zero or negative.
The Next Move: Profit Recalculation. Ecommerce conversion optimization is irrelevant if every sale loses money. If this gate fails, you do not necessarily need a higher conversion rate; you need better unit economics. The correct path is investigating price increases, adjusting free-shipping thresholds, creating product bundles to increase average order value (AOV), or reducing acquisition costs.
Ecommerce CRO is an exercise in operational discipline, not a checklist of best practices. By demanding evidence at each of these five gates, you eliminate the guesswork from optimization. If you are struggling to pinpoint the initial leak and asking why a website is not converting, start by locating the very first broken stage in your analytics. If the failure occurs late in the funnel, reviewing common cart abandonment reasons can guide your logistical and checkout repairs. Finally, if orders flow but the math fails, run your figures through an ecommerce profit calculator to reassess your unit economics. Find the first broken gate, choose one defensible next move, measure the impact, and only then continue to the next stage in the funnel.
As you adjust your site's information based on this diagnosis, Foundax offers visual editing and preview for product, site-page, and blog SEO information. Because important SEO fields can be sourced from product facts as a single source of truth, this helps reduce the risk that promotion, price, or inventory changes leave SEO information stale.
If visitors from paid campaigns arrive but stay for zero seconds, immediately bounce, or arrive from regions you do not ship to, the failure is occurring at the very first gate: qualified landing sessions. The issue is not your website design, but rather campaign targeting, search intent mismatch, or bot traffic bringing in unqualified visitors. Halt your current sitewide optimization efforts and investigate your ad targeting and keyword search intent to ensure you are acquiring legitimate potential buyers.
When traffic reaches the product page but fails to convert to an add-to-cart event, the page is failing to persuade the buyer at the stated price. This points to a breakdown in offer presentation and trust, rather than general site navigation or traffic quality. Audit your product pages to improve pricing presentation, upgrade product photography, clarify the call-to-action, and ensure trust signals like warranties and reviews are highly visible.
A steep drop-off after items are carted, particularly immediately after the shipping calculation step, indicates logistical or technical friction. Buyers who reached this step desired the product but were deterred by missing preferred delivery options, unmet return expectations, or technical issues in the payment gateway. Do not redesign your product pages; instead, investigate your shipping policy clarity, delivery pricing structures, and payment methods to remove the specific checkout friction.